
By Jesse Mawhinney
Source: Hubspot
At the end of every year, we like to read through some of the major reports on inbound marketing, content marketing, social media, and online behavior.
It’s amazing how fast things can change in 12 short months — and 2016 was certainly no exception.
This year, we’ve seen the importance of visual content emphasized by the changes that occurred across almost every major social network, including Facebook, Snapchat, Instagram, and Twitter. At the same time, videos have become powerful tools for brands looking to communicate more easily with their readers.
To help you keep pace with these trends, let’s take a look at some marketing statistics that demonstrate the impact visual content has on reach, engagement, and sales. The stats are categorized by General Visual Content, Video, Emerging Visual Marketing, Infographics, and Social Media.
42 Stats You Should Know About Visual Content Marketing in 2017
General Visual Content Statistics
1) 37% of marketers said visual marketing was the most important form of content for their business, second only to blogging (38%). (Source)
2) 74% of social media marketers use visual assets in their social media marketing, ahead of blogs (68%) and videos (60%). (Source)
3) When people hear information, they’re likely to remember only 10% of that information three days later. However, if a relevant image is paired with that same information, people retained 65% of the information three days later. (Source)
4) B2C marketers place greater importance on visual content than B2B marketers. (Source)
5) 51% of B2B marketers prioritized creating visual content assets in 2016. (Source)

Source: Content Marketing Institute
Video Marketing Statistics
6) By 2017, video content will represent 74% of all internet traffic. (Source)
7) Cisco projects that global internet traffic from videos will make up 80% of all internet traffic by 2019. (Source)
8) 76.5% of marketers and small business owners in an Animoto survey who have used video marketing say it had a direct impact on their business. (Source)
9) 34% of B2C marketers say pre-produced video will be critical to content marketing success in 2017. (Source)
10) 4X as many consumers would prefer to watch a video about a product than to read about it. (Source)
11) More than 60% of marketers and small business owners said they planned to increase investment in video marketing in 2017. (Source)
12) 62% of B2B marketers rated videos as an effective content marketing tactic in 2016. (Source)
13) Using the word “video” in an email subject line boosts open rates by 19% and clickthrough rates by 65%. (Source)
14) In a 2016 HubSpot survey, 43% of consumers wanted to see more video content in 2016. (Source)
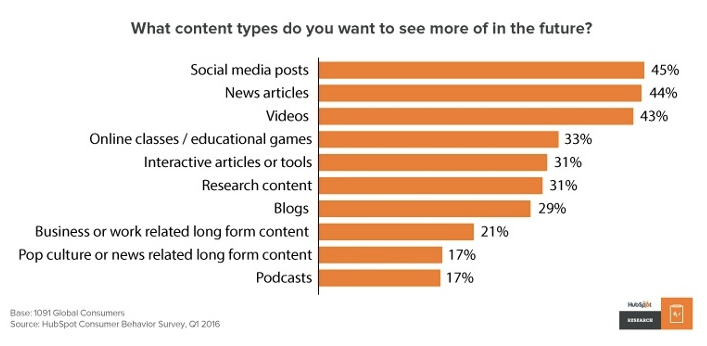
Source: HubSpot Research
Emerging Visual Marketing Trends
15) In 2016, 14% of marketers used live video. (Source)
16) Facebook users spend 3X more time watching live videos than traditional videos. (Source)
17) 51% of all video plays are on mobile devices — this growth represents a 15% increase from 2015 and a 203% increase from 2014. (Source)